


How K6 Load Testing and Datadog Data visualization bring clarity to Performance Testing.
What is performance testing?
In today’s world, the IT field continues to expand and diversify. Let’s take a closer look at performance testing, a specific way of testing APIs. First, let me briefly explain what an API is: an Application Program Interface that allows a user, via an application, to access databases or data services.
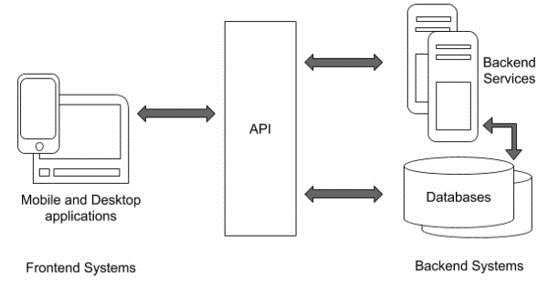
Fig. 1: Application interaction via API
Performance testing involves assessing server results under various simulated application usage scenarios or load situations. This may include spike tests or load tests, as seen in Fig. 2. Such tests help retrieve metrics like server response time, maximum user capacity before crashing, and CPU utilization percentage.
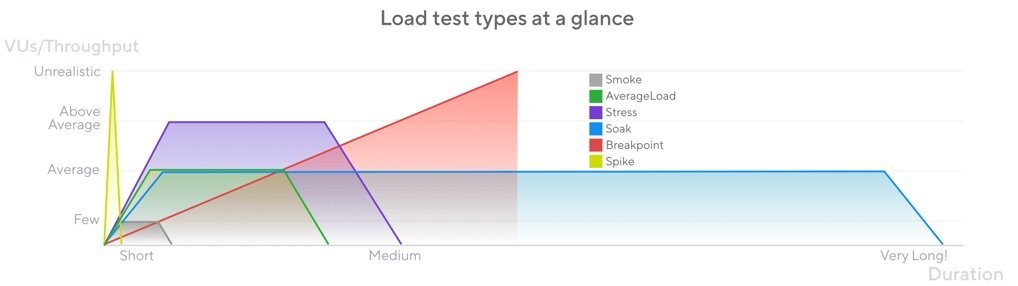
Fig. 2: Load test types at a glance
What makes K6 interesting?
First, it is simple to set up and use. The project structure doesn’t matter much; the key is to specify the entry file in the configuration. Then, create a test with different steps corresponding to the scenario, along with associated requests. Once the scenario is defined, configure the test execution, determining the test duration, number of users, and time period (details the type of execution possible here: https://k6.io/docs/using-k6/scenarios/executors/).
Secondly, K6 is flexible and adaptive. It offers various predefined metrics and a built-in report, but everything can be customized. You can create new metrics based on existing ones or from scratch. Create your own report with the desired information and configure thresholds and checks on the tests. Checks are elements verified within the tests, like a response value, while thresholds are post-test verifications to determine success. Examples of thresholds would be ensuring no response time exceeds 10 seconds, no request failures, or at least 90% of successful tests.
A final important point is K6’s capability to visualize data. Datadog, with its K6 module, allows real-time visualization of reports through a web page. Configuring Datadog is straightforward: add your API key to your project and use the tag –out statsd in your K6 command. This allows you to view basic results. For specific metrics or filtered requests, additional configurations are possible.
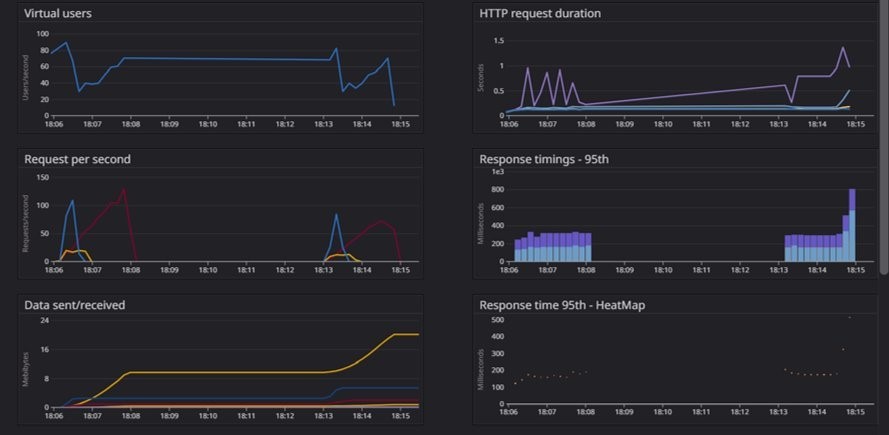
Fig. 3: Example of Datadog visualization of K6 scenario

Arthis Bruyere – Quality Assurance Automation Engineer
Your Content Goes Here